For steels, the microstructure and phase fractions in the iron-carbon diagram can be determined using the lever rule.
Introduction
For many applications it is important to know exactly what microstructure or phase fractions a steel is composed of at a certain carbon content. This ultimately necessitates a calculation. In order to carry out this, however, the entire iron-carbon phase diagram must be considered. Therefore, the complete phase diagram of the metastable system is briefly described below, before the determination of the microstructure and phase fractions is finally explained.
Up to now, the iron-carbon phase diagram has only been considered up to a carbon content of 2 % (steel part). At higher carbon concentrations, further phase transformations occur, which lead to a different microstructure. Such ferrous materials are then no longer referred to as steels but as cast iron. In the corresponding article on cast iron, the microstructure formation of such materials is described in more detail.
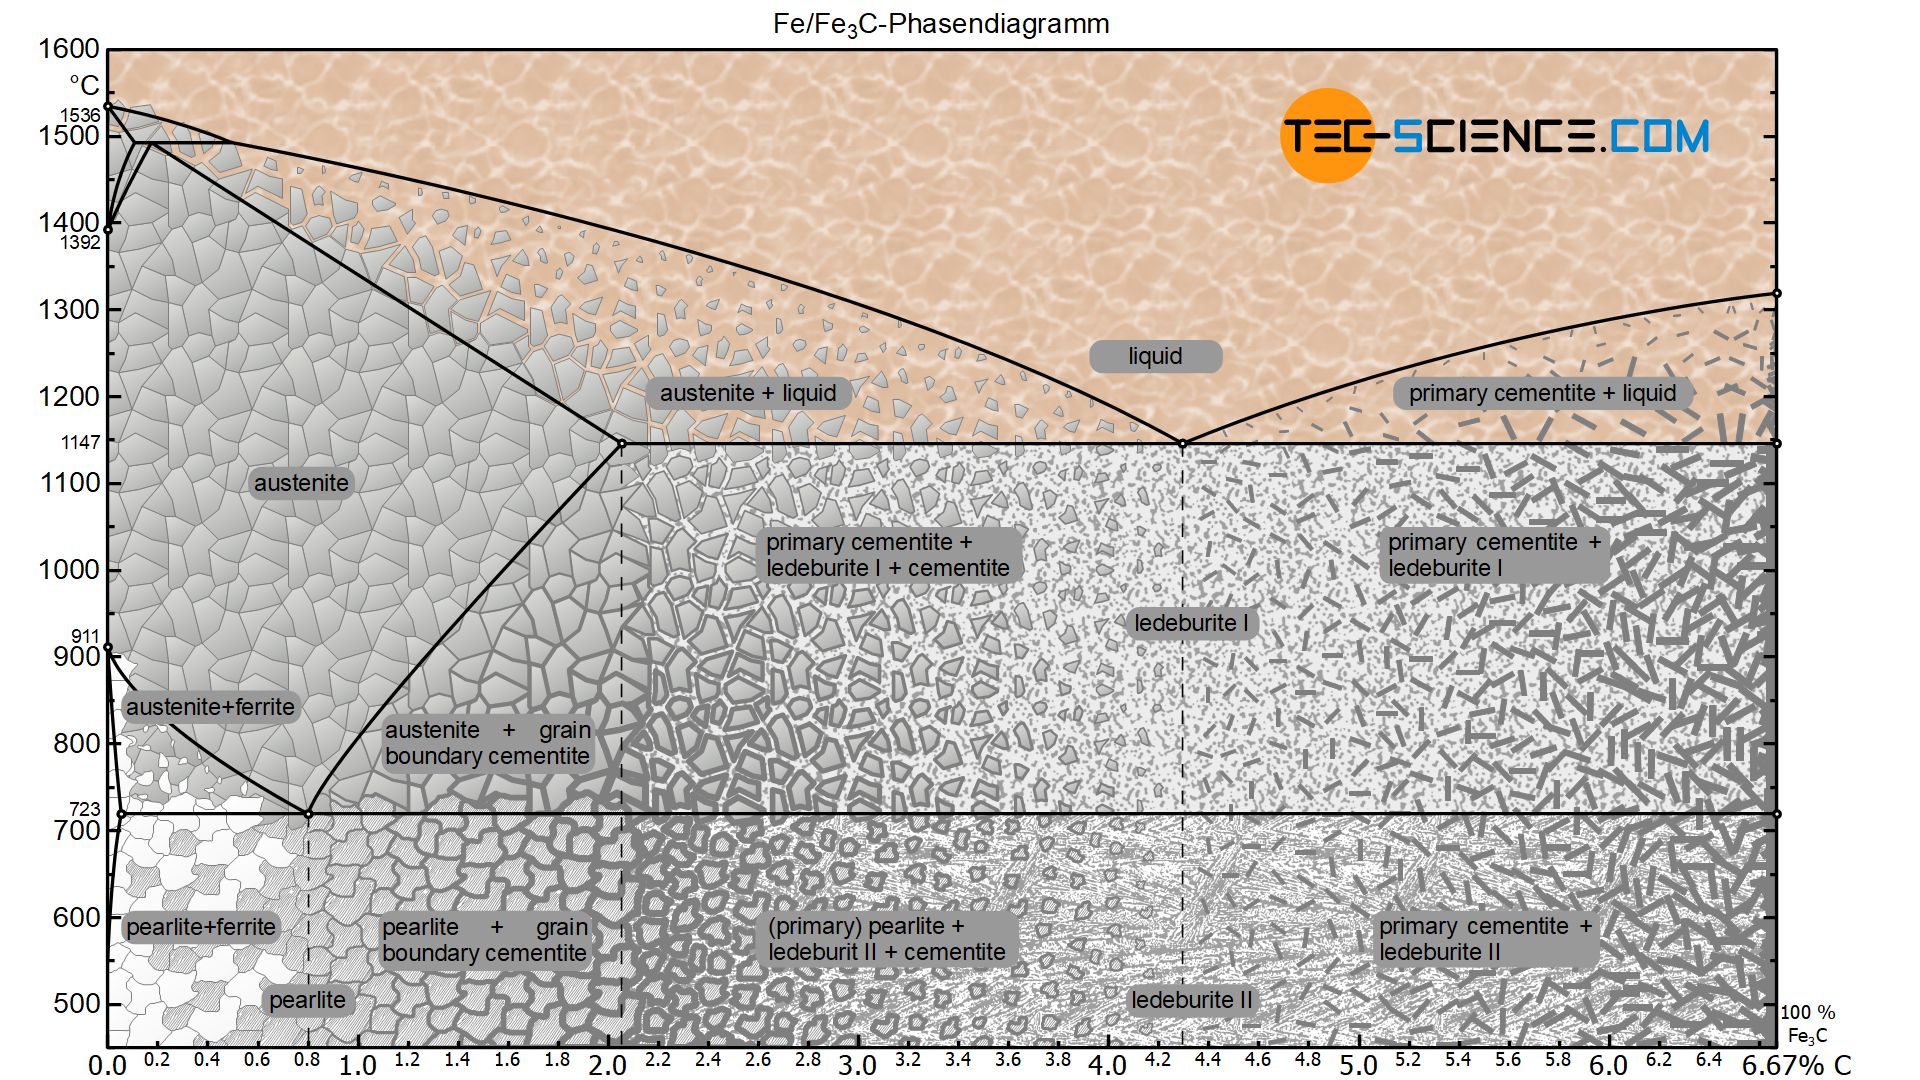
In principle, however, the iron-carbon phase diagram of the metastable system ends at a carbon content of 6.67 %, since the microstructure consists of 100 % cementite. Chemically, the cementite consists of three iron atoms (each with an atomic mass of 56 u) and one carbon atom (with an atomic mass of 12 u). Thus, the mass-related carbon content in the cementite is 6.67 %:
\begin{align}
&\underline{\text{carbon content}} = \frac{12u}{12u+3 \cdot 56u} \cdot 100 \text{ %} = \underline{6.67 \text{ %}} \\[5px]
\end{align}
Determination of the microstructure fractions and phase fractions
In principle, the microstructure and phase fractions are determined by applying the lever rule. The lever arms must always be pulled to the corresponding microstructural or phase boundaries. In the following, the microstructure and phase fractions at room temperature for an hyper- and hypoeutectoid steel will be determined as an example.
Hypoeutectoid steels
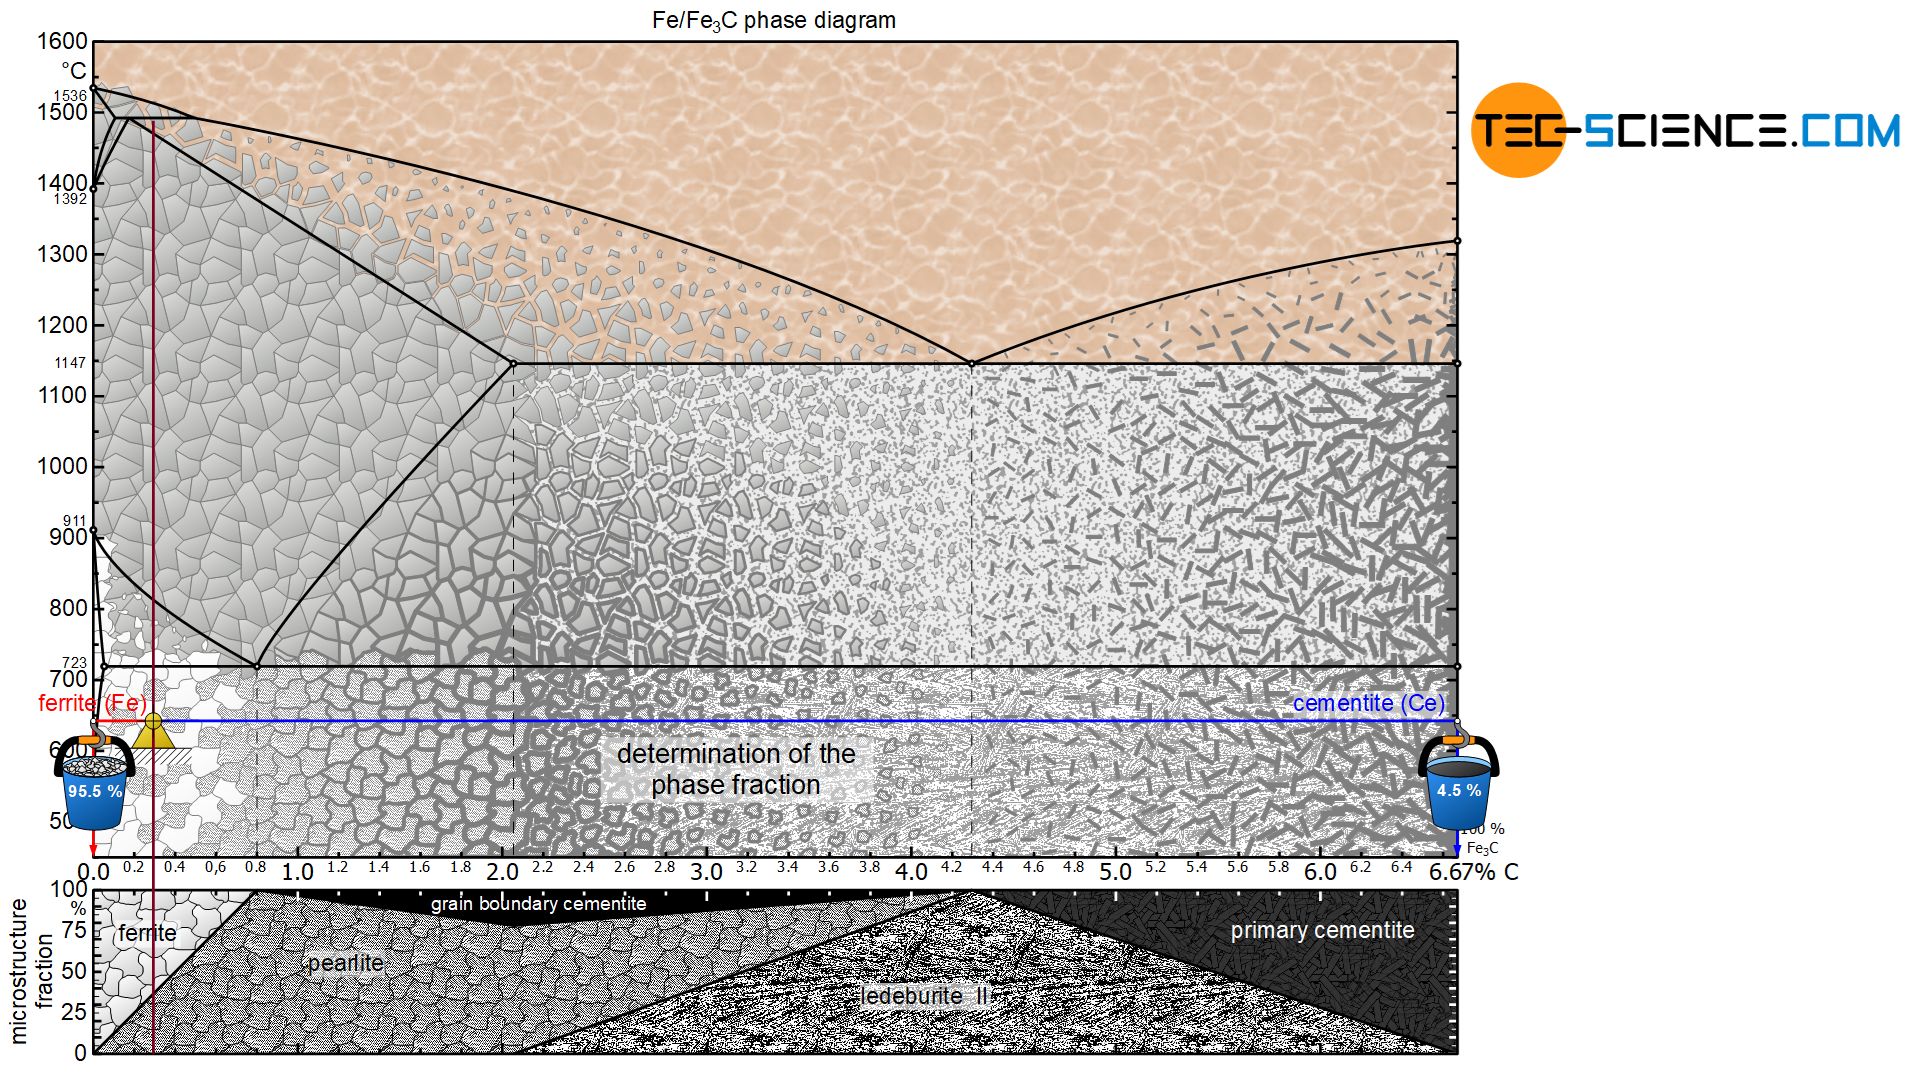
In a hypoeutectoid (hypoperlitic) steel, the microstructure consists of ferrite and pearlite grains at room temperature. In order to determine the respective microstructure fractions, the lever arms are drawn accordingly from the considered state point up to the ferrite phase region (at 0 % carbon) and to the pearlite limit (at 0.8 % carbon).
For a steel with, for example, 0.3 % carbon, this results in a ferrite content of 62.5 % at room temperature and a corresponding pearlite content of 37.5%:
\begin{align}
&\underline{\text{ferrite}} = \frac{0.8-0.3}{0.8} \cdot 100 \text{ %} = \underline{62.5 \text{ %}} \\[5px]
&\underline{\text{pearlite}} = \frac{0.3}{0.8} \cdot 100 \text{ %} = \underline{37.5 \text{ %}} \\[5px]
\end{align}
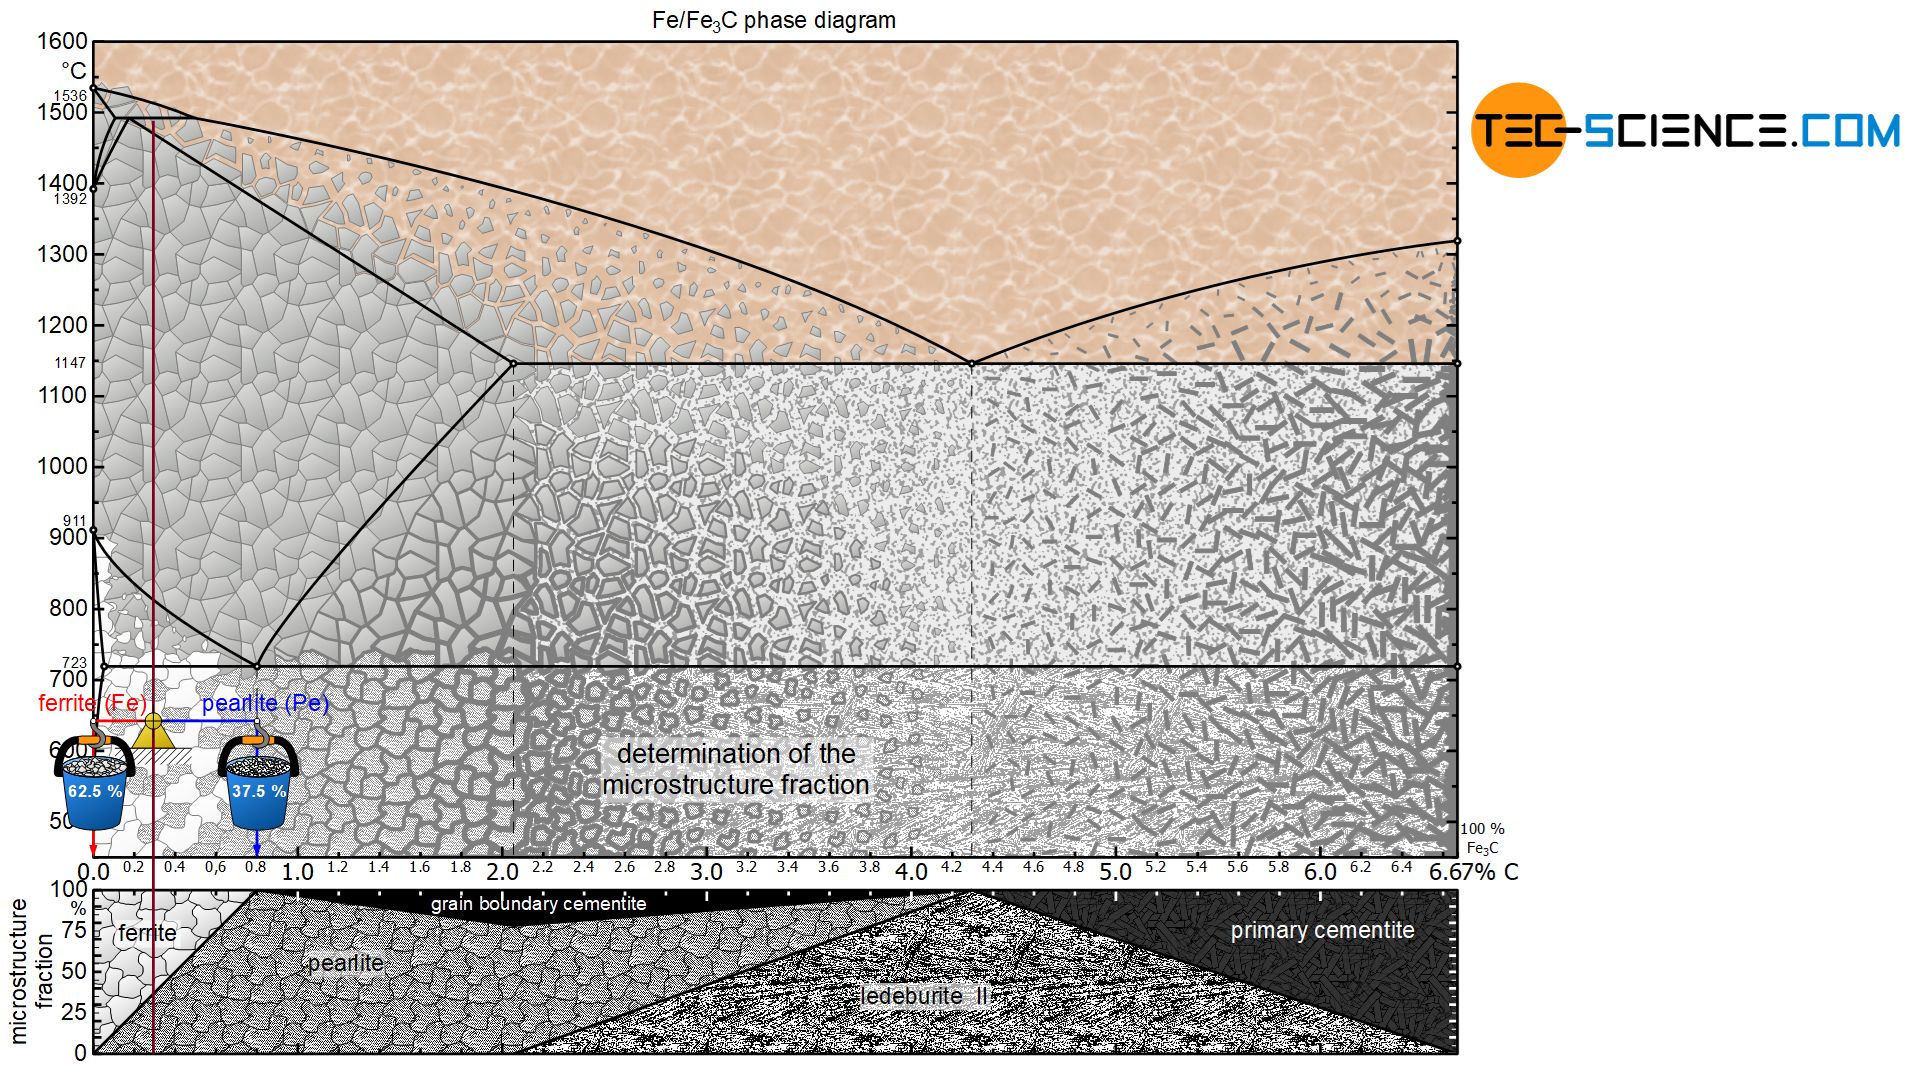
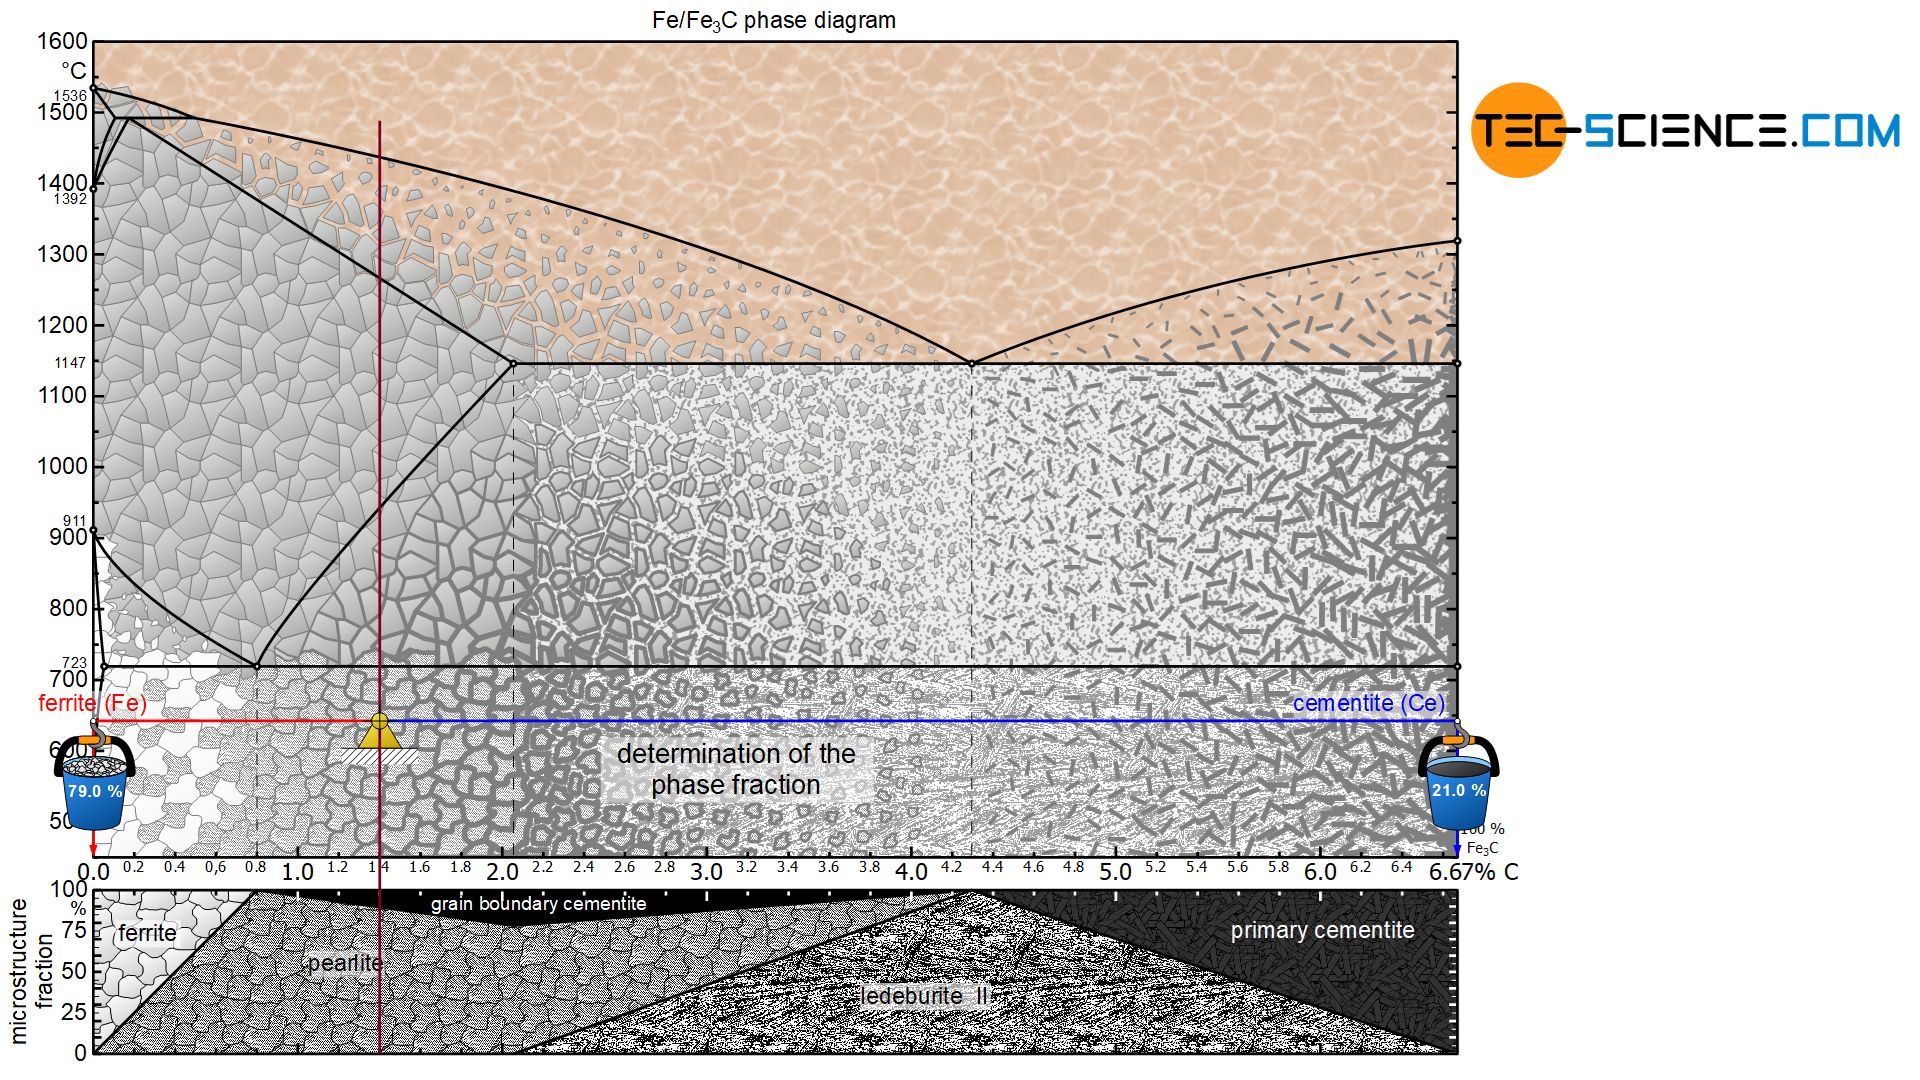
Due to the lever rule, there is generally a linear relationship between the carbon content and the microstructure fractions. For a hypoeutectoid steel, the fraction of pearlite increases steadily with a higher carbon content until it finally reaches 100 % at 0.8 % carbon. Accordingly, the ferrite content decreases to 0 %. The explicit relationship is shown in a microstructure diagram below the phase diagram.
The term microstructure fraction (“grain fraction”) should not be confused with the term phase fraction at this point! After all, the microstructural component pearlite consists of a phase mixture consisting of ferrite as well as cementite. The steel can thus also be characterized by the phase components ferrite and cementite instead of the microstructural components ferrite and pearlite. The procedure for determining the phase fractions is basically identical, but it must be noted that the lever arms must then be drawn up to the respective phase boundaries ferrite and cementite.
For the hypoeutectoid steel with 0.3 % carbon, the total phase content of ferrite is 95.5%. The remaining 4.5 % is finally accounted for by the cementite phase:
\begin{align}
&\underline{\text{ferrite}} = \frac{6.67-0.3}{6.67} \cdot 100 \text{ %} = \underline{95.5 \text{ %}} \\[5px]
&\underline{\text{cementite}} = \frac{0.3}{6.67} \cdot 100 \text{ %} = \underline{4.5 \text{ %}} \\[5px]
\end{align}
Hypereutectoid steels
The microstructure constituents of hypereutectoid steels can be determined in the same way as for hypoeutectoid steels. The lever arms are pulled to the respective microstructure components of the pearlite (at 0.8 % carbon) and the grain boundary cementite (at 6.67 % carbon).
For a steel with, for example, 1.4 % carbon, this results in a pearlite fraction of around 89.8 % at room temperature and a corresponding grain boundary cementite fraction of 10.2 %:
\begin{align}
&\underline{\text{pearlite}} = \frac{6.67-1.4}{6.67-0.8} \cdot 100 \text{ %} = \underline{89.8 \text{ %}} \\[5px]
&\underline{\text{grain boundary cementite}} = \frac{1.4-0.8}{6.67-0.8} \cdot 100 \text{ %} = \underline{10.2 \text{ %}} \\[5px]
\end{align}
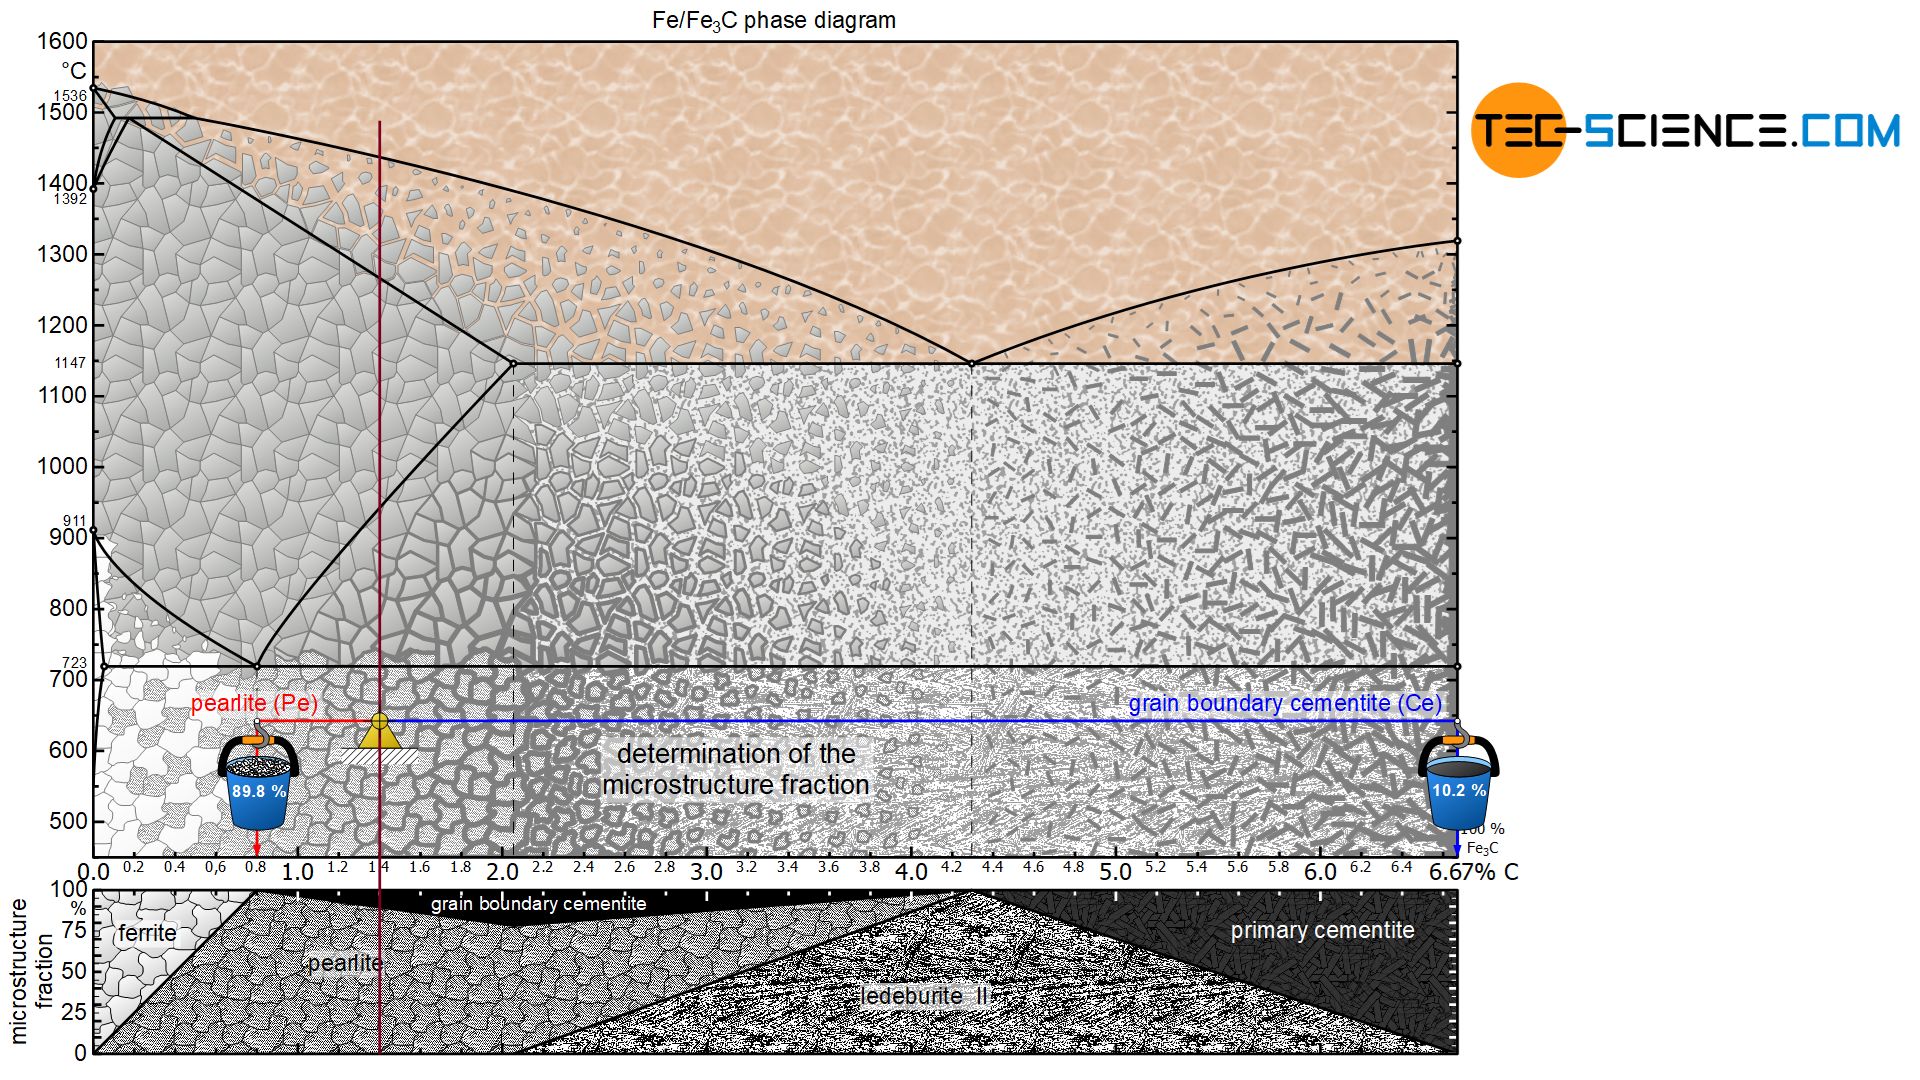
For a hypereutectoid steel, the proportion of pearlite decreases steadily with increasing carbon content to a minimum of 78.5 % (at 2.06 % carbon). Accordingly, the fraction of grain boundary cementite increases to a maximum of 21.5 %. The more detailed relationship is shown in the corresponding microstructure diagram below the iron-carbon phase diagram.
For a hypereutectoid steel, too, the term microstructure fraction must again be distinguished from the term phase fraction. Finally, the phase cementite is not only at the grain boundaries but also in the pearlite microstructure, which also consists of ferrite. The corresponding phase proportions of ferrite and cementite can be determined after pulling the lever arms to the respective phase boundaries.
For the hypereutectoid steel with 1.4 % carbon, the total phase fraction of ferrite is 79.0 %. The remaining 21.0 % are finally accounted for by the cementite phase:
\begin{align}
&\underline{\text{ferrite}} = \frac{6.67-1.4}{6.67} \cdot 100 \text{ %} = \underline{79.0 \text{ %}} \\[5px]
&\underline{\text{cementite}} = \frac{1.4}{6.67} \cdot 100 \text{ %} = \underline{21.0 \text{ %}} \\[5px]
\end{align}
